Article
A Step-by-Step Guide to RICE Scoring in Jira Product Discovery
Mastering Jira Product Discovery


Product teams face a constant challenge. There are always more ideas than time and resources. Deciding what to build next is one of the most critical jobs. Gut feelings and loud opinions lead to wasted effort. A structured system is better.
The RICE framework helps teams make data-informed decisions. It stands for Reach, Impact, Confidence, and Effort. It provides a systematic way to evaluate and compare initiatives. Jira Product Discovery (JPD) is an ideal tool for implementing RICE. Its flexibility with custom fields and formulas makes it a powerful platform for prioritization.
This guide will show you how to set up RICE scoring in JPD. It is a practical, step-by-step walkthrough. The goal is to create a clear, objective process for your roadmap decisions. This builds stakeholder alignment and helps you deliver more value.
tl;dr: Using the Product Discovery Prioritization Template
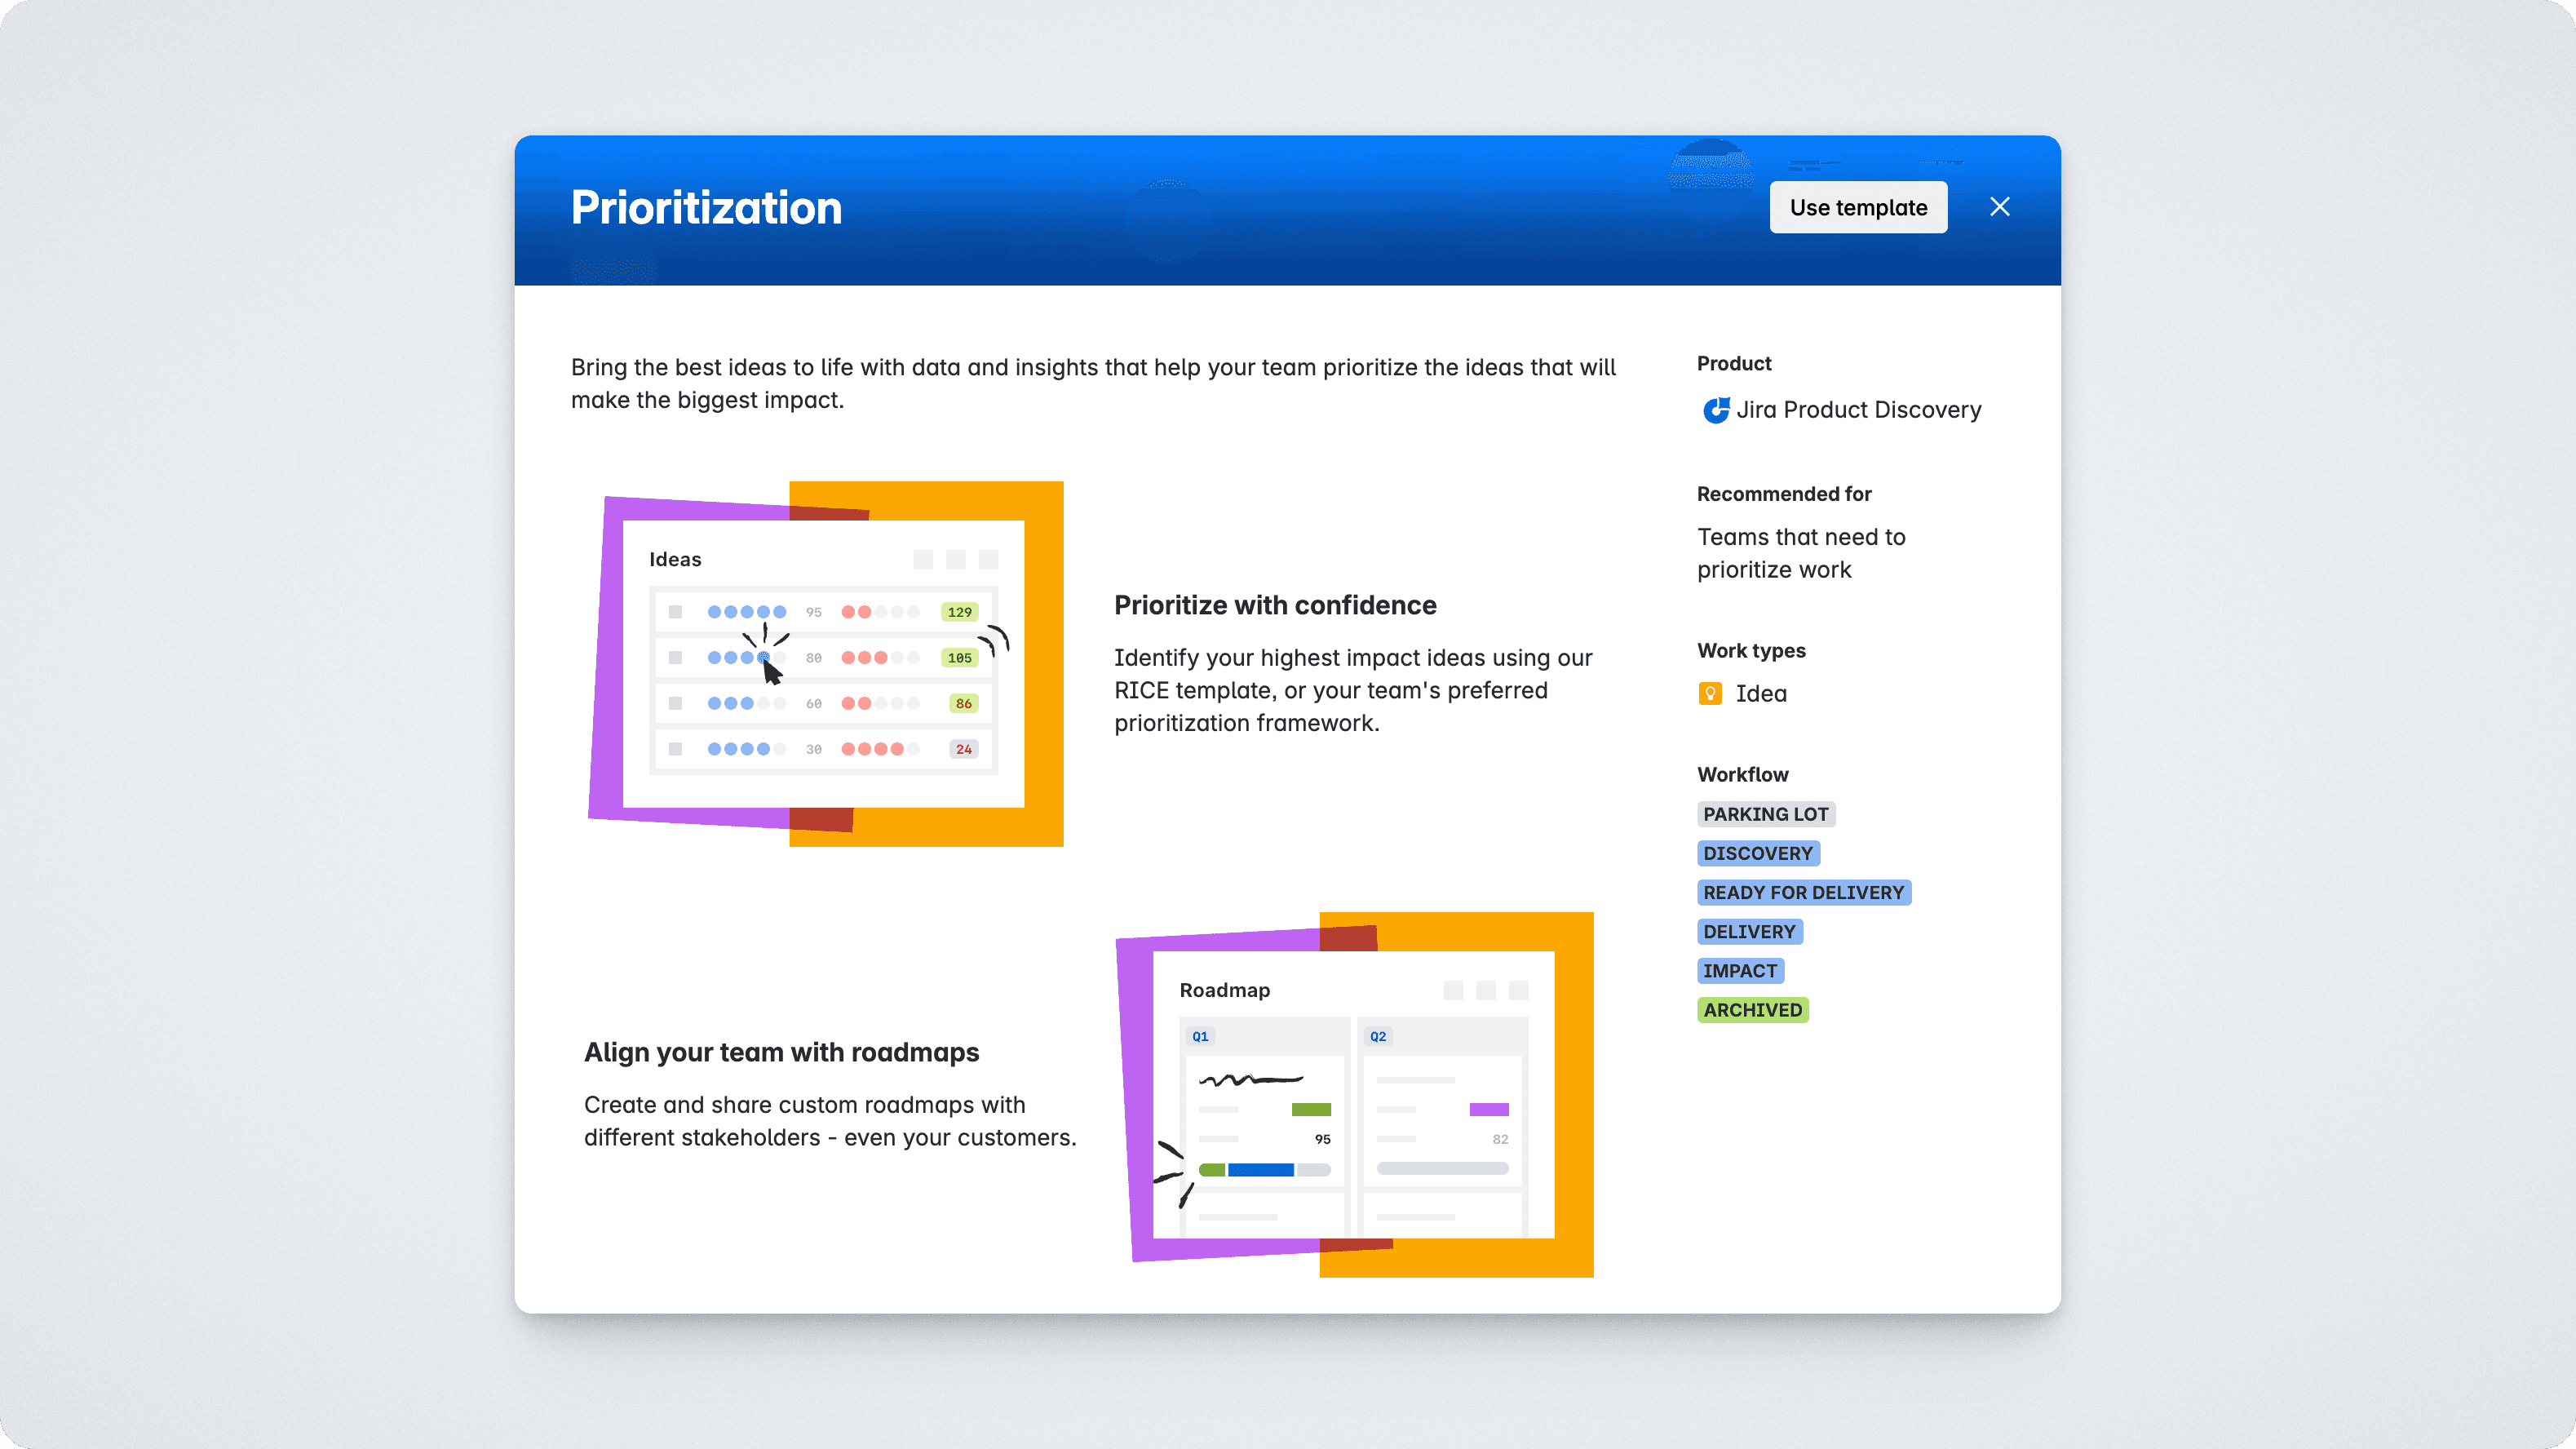
We recommend to read on and learn how RICE works in more detail, but if you are in a hurry and just looking to get started fast, you can simply use the Jira Product Discovery Prioritization template.
Here are the steps to create a new project featuring RICE:
Click the "+" icon next the the project section in the sidebar
Click "Product management" in the list on the left.
Select the "Prioritzation" template/
Click "Use template"
Fill in a Name and project Key.
Click "Create project".
The comes pre-configured with all the fields and formulas that you need. In this template, JPD uses simplified rating fields for Reach, Impact and Effort by default. And although we do like the simplicity, for our custom setup below, we will take a more flexible approach using number fields.
For a deeper understanding on how RICE works, and how to add the right fields and formulas to an existing project, read on.
Understanding the RICE Components
Before you touch Jira, your team must agree on what each RICE component means. This shared understanding is the foundation. Define your scales clearly and stick to them.
Reach
Reach quantifies how many people an idea will affect in a given timeframe. This could be customers per quarter or transactions per month. The goal is to measure the breadth of an idea's influence.
Define a specific, quantifiable measure. For example, you can use the actual estimated number of affected users per month. If you prefer a scale, it could look like this: 1 (0-100 users/month), 2 (101-500 users/month), or 3 (501-2000 users/month). Whatever you choose, be consistent. Your field description in JPD should state the exact metric.
Impact
Impact measures how much an idea will affect a key goal. This could be improving user conversion, increasing revenue, or boosting customer satisfaction. It measures the depth of an idea's influence.
A relative scale works well here. A common setup is: 3 for massive impact, 2 for high, 1 for medium, 0.5 for low, and 0.25 for minimal. Your team must document what each level means. For example, a "Massive" impact might mean a greater than 20% increase in a key performance indicator.
Confidence
Confidence reflects your certainty about the Reach and Impact estimates. It is a measure of how much evidence supports your numbers. High confidence comes from strong data like A/B test results or verified analytics. Low confidence comes from assumptions or opinions.
Use percentages to represent confidence. For example: 100% for high confidence, 80% for medium, 50% for low, and 20% for minimal. For the JPD formula, you will enter these as decimals: 1.0, 0.8, 0.5, and 0.2. Your team should agree on the evidence required for each tier.
Effort
Effort estimates the total time required from all teams to deliver the idea. This includes product, design, engineering, and any other relevant departments.
Person-months is a common and effective unit. It provides a consistent numerical value for calculation. You can use T-shirt sizes (Small, Medium, Large), but you must convert them to numbers for the formula. For example: S=1 person-week, M=2, L=4, XL=8. Consistency is the most important factor.
A quick note on JPD's default fields. JPD has fields for "Impact," "Confidence," and "Effort." These are often rating fields, like 1 to 5 dots. They are not suitable for the RICE formula, which requires multiplication and division. You must create new, 'Number' type custom fields for accurate calculations. This ensures the formula uses clean numerical inputs. Standardizing these scales across your organization also allows for meaningful comparison of initiatives across different projects.
Creating Custom Fields for RICE in JPD
With defined scales, you can now create the custom fields in Jira Product Discovery. You will need "Creator" permissions for the project. The process involves creating four separate 'Number' type fields.
You can create a new field from any view in your JPD project. Click the "Fields +" button and select "Create a new field."
1. Create "RICE Reach" Field
Name:
RICE Reach. Using a prefix like "RICE" helps differentiate these from default fields.Field Type: Select
Number.Description: Enter your team's agreed-upon definition. For example: "Estimated number of unique users affected per month. Enter the raw number (e.g., 1500)."
Click "Create".
2. Create "RICE Impact Score" Field
Name:
RICE Impact ScoreField Type: Select
Number.Description: Enter your defined scale. For example: "Rate impact on a scale of 0.25 to 3: 3=Massive, 2=High, 1=Medium, 0.5=Low, 0.25=Minimal. See documentation for definitions."
Click "Create".
3. Create "RICE Confidence %" Field
Name:
RICE Confidence %Field Type: Select
Number.Description: Enter your confidence scale, reminding users to use decimals. For example: "Enter confidence as a decimal: 1.0 for 100%, 0.8 for 80%, 0.5 for 50%, 0.2 for 20%. See guidelines for evidence required."
Click "Create".
4. Create "RICE Effort (Person-Months)" Field
Name:
RICE Effort (Person-Months). Replace "Person-Months" with your chosen unit.Field Type: Select
Number.Description: Enter your effort scale. For example: "Estimated team effort in person-months (e.g., 0.5, 1, 2, 3). Includes all work from product, design, and engineering."
Click "Create".
Crafting the RICE Score Custom Formula in JPD
With the four input fields ready, you can now create the formula field that calculates the RICE score automatically.
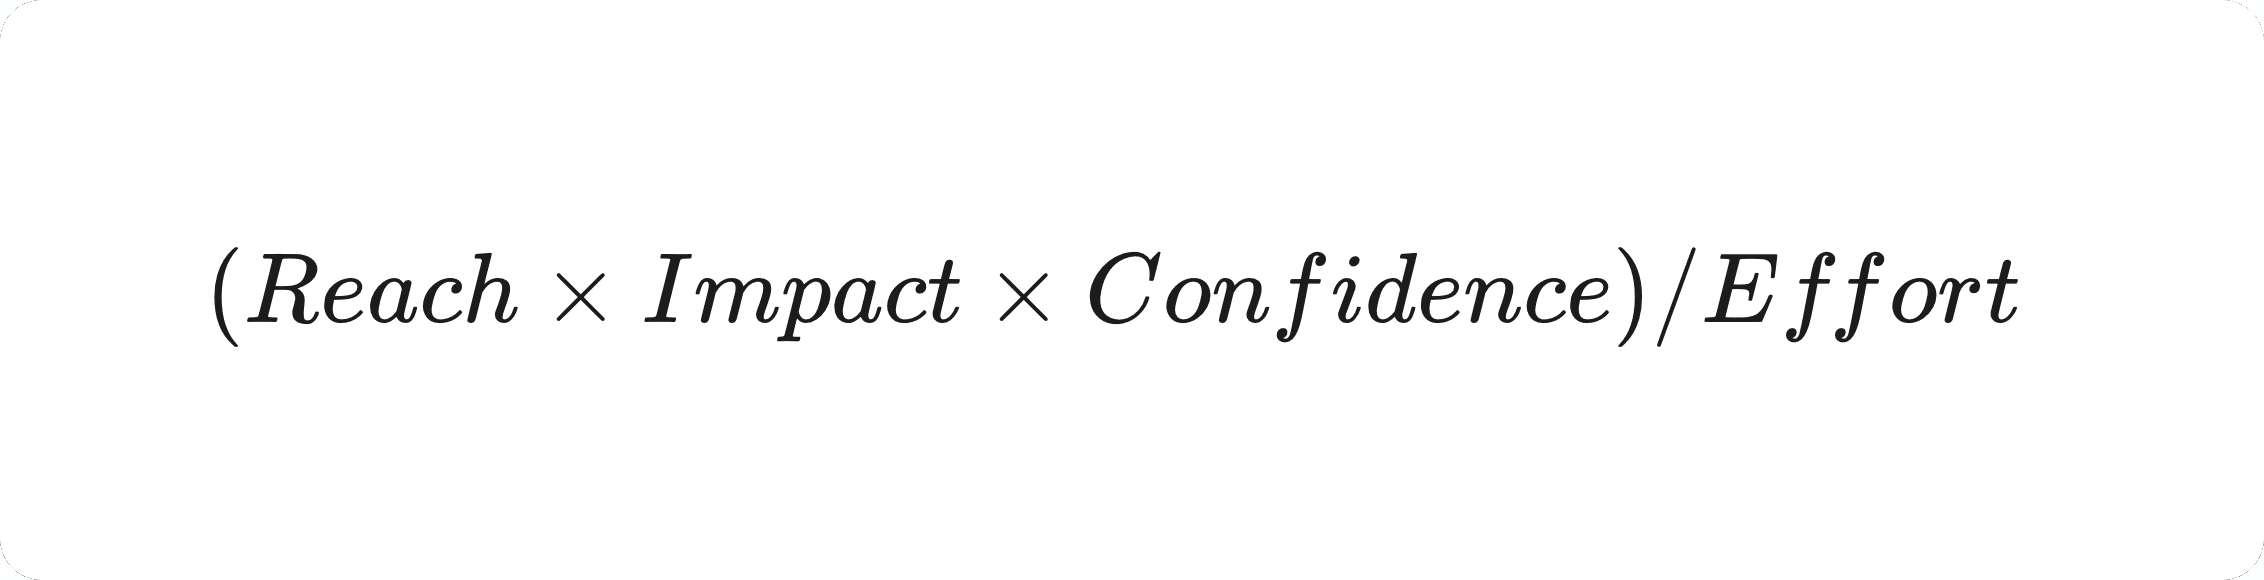
The RICE formula is:
Here are the steps to create the formula field:
From any view, click the "Fields +" button, then "Create a new field."
Name: Give it a clear name, like
RICE Score.Field Type: Select
Custom formula.Formula Type: Choose the
Write your ownoption.Expression: Enter the RICE formula using the exact names of the fields you just created. The field names must be enclosed in curly braces
{}.({RICE Reach} * {RICE Impact Score} * {RICE Confidence %}) / {RICE Effort (Person-Months)}JPD often provides real-time validation to help you catch errors. Ensure the names match perfectly.
Description: It's good practice to add an explanation. For example: "Calculated RICE score: (Reach * Impact * Confidence) / Effort. Higher scores indicate higher priority."
Formatting: After creating the field, you can add formatting to color-code the scores for quick visual reference.
Click "Create".
JPD's formula engine handles basic arithmetic. More complex logic is not directly supported in this field type, but this standard formula is all you need for RICE.
Applying RICE to a Sample Idea
Let's see how this works with a real example. Imagine the team is considering an idea: "Implement a new, streamlined user onboarding flow."
A product manager would fill in the four input fields for this idea.
Idea: Implement new user onboarding flow
RICE Reach:
1000(1,000 new users are expected to use this flow per month).RICE Impact Score:
3(The team expects a 'Massive' impact on user activation).RICE Confidence %:
0.8(80% confidence, based on strong user feedback and initial data).RICE Effort (Person-Months):
2(An estimated two person-months of total team effort).
As soon as these values are entered, the RICE Score field you created will automatically calculate the result.

This score of 1200 is now a tangible, comparable metric for this idea. It can be used in views to sort, filter, and discuss priorities.
Using List and Matrix Views
Once your ideas have RICE scores, you can use JPD's views to visualize and analyze them.
List View for Ranked Prioritization
The List View is perfect for creating a simple, ranked backlog.
Navigate to a List View or create a new one.
Click the "Fields +" button and add your
RICE Scorecolumn. It is also helpful to show the individual component fields (Reach, Impact, etc.) for context.Click the
RICE Scorecolumn header to sort it in descending order.
This immediately brings your highest-priority ideas to the top of the list.
Matrix View for Multi-Dimensional Analysis
The Matrix View helps facilitate deeper discussions. Instead of just looking at the final score, you can plot two of the input components against each other.
Create a new Matrix View.
Select fields for the X and Y axes. A classic combination is
RICE Impact Scorevs.RICE Effort (Person-Months).
This creates a visual impact/effort matrix. You can easily spot quick wins (high impact, low effort), major projects (high impact, high effort), and things to avoid (low impact, high effort). You could also plot the RICE Score against another factor, like Strategic Alignment, if you have a field for it. This view enriches the conversation beyond a single number.
Tips for Effective RICE Implementation and Team Alignment
A successful RICE implementation is about process and people, not just technical setup.
Set Clear Expectations and Roles. Everyone should know how the process works and what their role is. Who provides effort estimates? Who gathers data for Reach and Impact?
Regularly Review and Recalibrate Scales. Your initial definitions may need tuning. Schedule reviews to ensure the scales remain relevant as the team learns and the business evolves.
Involve the Team in Scoring. Prioritization is a team sport. Get effort estimates from engineering and design. Get Reach and Impact insights from sales and marketing. Discussing confidence levels openly surfaces assumptions.
Don't Treat RICE as Absolute. RICE is a guide, not a rule. It is an input for decision-making, not the decision itself. Qualitative insights, strategic goals, and dependencies still matter. The goal is better conversations, not blind obedience to a number.
Document Your RICE Process. Keep a simple document that explains your scales and process. This ensures consistency and helps new team members get up to speed.
Iterate on the Process. Start simple. See what works for your team and refine it. Clear communication and a simple method lead to better prioritization outcomes.
Prioritizing Smarter with RICE in JPD
Implementing RICE scoring in Jira Product Discovery gives your team a structured, data-informed approach to prioritization. By setting up custom fields and a clear formula, you move from subjective debates to objective discussions. Using JPD's views turns these scores into actionable insights.
Mastering RICE in JPD helps create a culture of transparency. Priorities become clear, well-understood, and focused on delivering the most value to your customers and your business.
For more insights into optimizing product management workflows and leveraging tools effectively, visit https://released.so.
Article
A Step-by-Step Guide to RICE Scoring in Jira Product Discovery
Mastering Jira Product Discovery
Product teams face a constant challenge. There are always more ideas than time and resources. Deciding what to build next is one of the most critical jobs. Gut feelings and loud opinions lead to wasted effort. A structured system is better.
The RICE framework helps teams make data-informed decisions. It stands for Reach, Impact, Confidence, and Effort. It provides a systematic way to evaluate and compare initiatives. Jira Product Discovery (JPD) is an ideal tool for implementing RICE. Its flexibility with custom fields and formulas makes it a powerful platform for prioritization.
This guide will show you how to set up RICE scoring in JPD. It is a practical, step-by-step walkthrough. The goal is to create a clear, objective process for your roadmap decisions. This builds stakeholder alignment and helps you deliver more value.
tl;dr: Using the Product Discovery Prioritization Template
We recommend to read on and learn how RICE works in more detail, but if you are in a hurry and just looking to get started fast, you can simply use the Jira Product Discovery Prioritization template.
Here are the steps to create a new project featuring RICE:
Click the "+" icon next the the project section in the sidebar
Click "Product management" in the list on the left.
Select the "Prioritzation" template/
Click "Use template"
Fill in a Name and project Key.
Click "Create project".
The comes pre-configured with all the fields and formulas that you need. In this template, JPD uses simplified rating fields for Reach, Impact and Effort by default. And although we do like the simplicity, for our custom setup below, we will take a more flexible approach using number fields.
For a deeper understanding on how RICE works, and how to add the right fields and formulas to an existing project, read on.
Understanding the RICE Components
Before you touch Jira, your team must agree on what each RICE component means. This shared understanding is the foundation. Define your scales clearly and stick to them.
Reach
Reach quantifies how many people an idea will affect in a given timeframe. This could be customers per quarter or transactions per month. The goal is to measure the breadth of an idea's influence.
Define a specific, quantifiable measure. For example, you can use the actual estimated number of affected users per month. If you prefer a scale, it could look like this: 1 (0-100 users/month), 2 (101-500 users/month), or 3 (501-2000 users/month). Whatever you choose, be consistent. Your field description in JPD should state the exact metric.
Impact
Impact measures how much an idea will affect a key goal. This could be improving user conversion, increasing revenue, or boosting customer satisfaction. It measures the depth of an idea's influence.
A relative scale works well here. A common setup is: 3 for massive impact, 2 for high, 1 for medium, 0.5 for low, and 0.25 for minimal. Your team must document what each level means. For example, a "Massive" impact might mean a greater than 20% increase in a key performance indicator.
Confidence
Confidence reflects your certainty about the Reach and Impact estimates. It is a measure of how much evidence supports your numbers. High confidence comes from strong data like A/B test results or verified analytics. Low confidence comes from assumptions or opinions.
Use percentages to represent confidence. For example: 100% for high confidence, 80% for medium, 50% for low, and 20% for minimal. For the JPD formula, you will enter these as decimals: 1.0, 0.8, 0.5, and 0.2. Your team should agree on the evidence required for each tier.
Effort
Effort estimates the total time required from all teams to deliver the idea. This includes product, design, engineering, and any other relevant departments.
Person-months is a common and effective unit. It provides a consistent numerical value for calculation. You can use T-shirt sizes (Small, Medium, Large), but you must convert them to numbers for the formula. For example: S=1 person-week, M=2, L=4, XL=8. Consistency is the most important factor.
A quick note on JPD's default fields. JPD has fields for "Impact," "Confidence," and "Effort." These are often rating fields, like 1 to 5 dots. They are not suitable for the RICE formula, which requires multiplication and division. You must create new, 'Number' type custom fields for accurate calculations. This ensures the formula uses clean numerical inputs. Standardizing these scales across your organization also allows for meaningful comparison of initiatives across different projects.
Creating Custom Fields for RICE in JPD
With defined scales, you can now create the custom fields in Jira Product Discovery. You will need "Creator" permissions for the project. The process involves creating four separate 'Number' type fields.
You can create a new field from any view in your JPD project. Click the "Fields +" button and select "Create a new field."
1. Create "RICE Reach" Field
Name:
RICE Reach. Using a prefix like "RICE" helps differentiate these from default fields.Field Type: Select
Number.Description: Enter your team's agreed-upon definition. For example: "Estimated number of unique users affected per month. Enter the raw number (e.g., 1500)."
Click "Create".
2. Create "RICE Impact Score" Field
Name:
RICE Impact ScoreField Type: Select
Number.Description: Enter your defined scale. For example: "Rate impact on a scale of 0.25 to 3: 3=Massive, 2=High, 1=Medium, 0.5=Low, 0.25=Minimal. See documentation for definitions."
Click "Create".
3. Create "RICE Confidence %" Field
Name:
RICE Confidence %Field Type: Select
Number.Description: Enter your confidence scale, reminding users to use decimals. For example: "Enter confidence as a decimal: 1.0 for 100%, 0.8 for 80%, 0.5 for 50%, 0.2 for 20%. See guidelines for evidence required."
Click "Create".
4. Create "RICE Effort (Person-Months)" Field
Name:
RICE Effort (Person-Months). Replace "Person-Months" with your chosen unit.Field Type: Select
Number.Description: Enter your effort scale. For example: "Estimated team effort in person-months (e.g., 0.5, 1, 2, 3). Includes all work from product, design, and engineering."
Click "Create".
Crafting the RICE Score Custom Formula in JPD
With the four input fields ready, you can now create the formula field that calculates the RICE score automatically.
The RICE formula is:
Here are the steps to create the formula field:
From any view, click the "Fields +" button, then "Create a new field."
Name: Give it a clear name, like
RICE Score.Field Type: Select
Custom formula.Formula Type: Choose the
Write your ownoption.Expression: Enter the RICE formula using the exact names of the fields you just created. The field names must be enclosed in curly braces
{}.({RICE Reach} * {RICE Impact Score} * {RICE Confidence %}) / {RICE Effort (Person-Months)}JPD often provides real-time validation to help you catch errors. Ensure the names match perfectly.
Description: It's good practice to add an explanation. For example: "Calculated RICE score: (Reach * Impact * Confidence) / Effort. Higher scores indicate higher priority."
Formatting: After creating the field, you can add formatting to color-code the scores for quick visual reference.
Click "Create".
JPD's formula engine handles basic arithmetic. More complex logic is not directly supported in this field type, but this standard formula is all you need for RICE.
Applying RICE to a Sample Idea
Let's see how this works with a real example. Imagine the team is considering an idea: "Implement a new, streamlined user onboarding flow."
A product manager would fill in the four input fields for this idea.
Idea: Implement new user onboarding flow
RICE Reach:
1000(1,000 new users are expected to use this flow per month).RICE Impact Score:
3(The team expects a 'Massive' impact on user activation).RICE Confidence %:
0.8(80% confidence, based on strong user feedback and initial data).RICE Effort (Person-Months):
2(An estimated two person-months of total team effort).
As soon as these values are entered, the RICE Score field you created will automatically calculate the result.
This score of 1200 is now a tangible, comparable metric for this idea. It can be used in views to sort, filter, and discuss priorities.
Using List and Matrix Views
Once your ideas have RICE scores, you can use JPD's views to visualize and analyze them.
List View for Ranked Prioritization
The List View is perfect for creating a simple, ranked backlog.
Navigate to a List View or create a new one.
Click the "Fields +" button and add your
RICE Scorecolumn. It is also helpful to show the individual component fields (Reach, Impact, etc.) for context.Click the
RICE Scorecolumn header to sort it in descending order.
This immediately brings your highest-priority ideas to the top of the list.
Matrix View for Multi-Dimensional Analysis
The Matrix View helps facilitate deeper discussions. Instead of just looking at the final score, you can plot two of the input components against each other.
Create a new Matrix View.
Select fields for the X and Y axes. A classic combination is
RICE Impact Scorevs.RICE Effort (Person-Months).
This creates a visual impact/effort matrix. You can easily spot quick wins (high impact, low effort), major projects (high impact, high effort), and things to avoid (low impact, high effort). You could also plot the RICE Score against another factor, like Strategic Alignment, if you have a field for it. This view enriches the conversation beyond a single number.
Tips for Effective RICE Implementation and Team Alignment
A successful RICE implementation is about process and people, not just technical setup.
Set Clear Expectations and Roles. Everyone should know how the process works and what their role is. Who provides effort estimates? Who gathers data for Reach and Impact?
Regularly Review and Recalibrate Scales. Your initial definitions may need tuning. Schedule reviews to ensure the scales remain relevant as the team learns and the business evolves.
Involve the Team in Scoring. Prioritization is a team sport. Get effort estimates from engineering and design. Get Reach and Impact insights from sales and marketing. Discussing confidence levels openly surfaces assumptions.
Don't Treat RICE as Absolute. RICE is a guide, not a rule. It is an input for decision-making, not the decision itself. Qualitative insights, strategic goals, and dependencies still matter. The goal is better conversations, not blind obedience to a number.
Document Your RICE Process. Keep a simple document that explains your scales and process. This ensures consistency and helps new team members get up to speed.
Iterate on the Process. Start simple. See what works for your team and refine it. Clear communication and a simple method lead to better prioritization outcomes.
Prioritizing Smarter with RICE in JPD
Implementing RICE scoring in Jira Product Discovery gives your team a structured, data-informed approach to prioritization. By setting up custom fields and a clear formula, you move from subjective debates to objective discussions. Using JPD's views turns these scores into actionable insights.
Mastering RICE in JPD helps create a culture of transparency. Priorities become clear, well-understood, and focused on delivering the most value to your customers and your business.
For more insights into optimizing product management workflows and leveraging tools effectively, visit https://released.so.
Use cases
Resources
Backed by


Use cases
Backed by
Use cases
Resources
Backed by